Sunday 31 October 2021
Rate of Minimum Wages (Variable Dearness Allowance) Revised for Central sphere workers
Ministry of Labour & Employment
Rate of Minimum Wages (Variable Dearness Allowance) Revised for Central sphere workers
At a time when the country is struggling with COVID-19 pandemic, in a major relief to different category of workers engaged in various scheduled employments in the central sphere, the Ministry of Labour & Employment, Government of India has notified and revised the rate of Variable Dearness Allowance (VDA) with effect from 1.10.2021.
The VDA is revised on the basis of average Consumer Price Index for industrial workers (CPI-IW) a price index compiled by Labour Bureau (an attached office of Ministry of Labour & Employment). The average CPI-IW for the months of January to June, 2021 was used for undertaking the latest Variable Dearness Allowance (VDA) revision.
Shri Bhupender Yadav, Minister of Labour & Employment, Environment, Forest & Climate Change, said that this will benefit around 1.5 crore workers engaged in various scheduled employment in the central sphere across the country i.e. (a) Construction, maintenance of Roads, Runways, Building operations etc.; (b) Sweeping and cleaning; (c) Loading and unloading; (d) Watch and ward; (e) Mines & (f) Agriculture and said that this is in line with Prime Minister’s vision of “Sabka Saath, Sabka Vikas, Sabka Vishwas and Sabka Prayas” and this increase will be effective from 1st October, 2021 and wished all the nation builders greetings of Happy Deepavali.
The move will benefit around 1.50 crore workers engaged in various scheduled employments in central sphere across the country. This
hike in Variable Dearness Allowance (VDA) will support these workers particularly in the current pandemic times.
Rates of wages for different categories of employees
Schedule employment | Category of employees | Rate of wages including Variable Dearness Allowance Area wise per day (in Rupees) | ||
A | B | C | ||
Construction or maintenance of roads or runways or building operations etc. | Unskilled | 654 | 546 | 437 |
Semi-Skilled/Unskilled Supervisor | 724 | 617 | 512 | |
Skilled/Clerical | 795 | 724 | 617 | |
Highly Skilled | 864 | 795 | 724 | |
Sweeping and Cleaning |
-- | 654 | 546 | 437 |
Loading and Unloading workers |
-- | 654 | 546 | 437 |
Watch and Ward | Without Arms | 795 | 724 | 617 |
With Arms | 864 | 795 | 724 | |
Agriculture | Unskilled | 417 | 380 | 377 |
Semi-Skilled/Unskilled Supervisor | 455 | 419 | 384 | |
Skilled/Clerical | 495 | 455 | 418 | |
Highly Skilled | 547 | 509 | 455 | |
For Mines employees
Category | Above Ground | Below Ground |
Unskilled | 437 | 546 |
Semi-Skilled/Unskilled Supervisor | 546 | 654 |
Skilled/Clerical | 654 | 762 |
Highly Skilled | 762 | 851 |
The rates fixed for scheduled employment in Central sphere are applicable to the establishments under the authority of Central Government, Railway Administration, Mines, Oil fields, major ports or any corporation established by the Central Government. These rates are equally applicable to contract and casual employees/workers.
Shri D.P.S.Negi, Chief Labour Commissioner (Central) said that the minimum wages (VDA) in respect of scheduled employment under central sphere is revised twice in a year i.e. 1st April and 1st October on the basis of Consumer Price Index for industrial workers released by Labour Bureau, an attached office of Ministry of Labour & Employment. Further, period under consideration for this order is from January to June, 2021 as per the Gazette Notification.
The enforcement of Minimum Wages Act in the Central sphere is ensured through the Inspecting Officers of Chief Labour Commissioner (Central) Organization across the country for employees/workers engaged in the scheduled employment in the central sphere.
**********
Consumer Price Index for Industrial Workers (2016=100) – September, 2021
Ministry of Labour & Employment
Consumer Price Index for Industrial Workers (2016=100) – September, 2021
The Labour Bureau, an attached office of the M/o Labour & Employment, has been compiling Consumer Price Index for Industrial Workers every month on the basis of retail prices collected from 317 markets spread over 88 industrially important centres in the country. The index is compiled for 88 centres and All-India and is released on the last working day of succeeding month. The index for the month of September, 2021 is being released in this press release.
The All-India CPI-IW for September, 2021 increased by 0.3 points and stood at 123.3 (one hundred twenty three and point three). On 1-month percentage change, it increased by 0.24 per cent with respect to previous month compared to an increase of 0.62 per cent recorded between corresponding months a year ago.
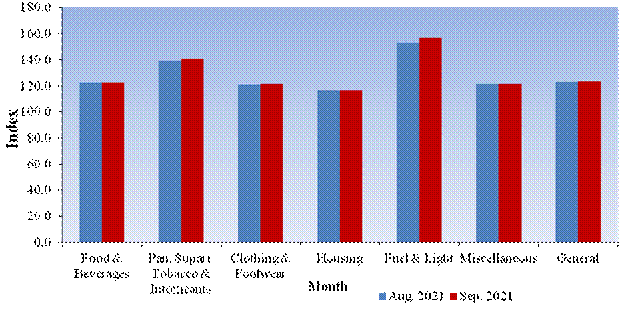
The maximum upward pressure in current index came from Fuel & Light group contributing 0.21 percentage points to the total change. However, this increase was largely checked by Rice, Apple, Petrol for Vehicle, etc. putting downward pressure on the index.
Shri D.P.S.Negi, Principal Labour & Employment Advisor said that the increase observed in index is mainly due to items like Cooking Gas, Fire wood & Chips, Match Box, Poultry/Chicken, Mustard Oil, Brinjal, Sugar-white, Doctor/Surgeon’s Fee, etc.which experienced an increase in prices.
At centre level, Haldia recorded maximum increase of 3.2 points followed by Tirunelveli and Darjeeling with 3 points each. Among others, 5 centres observed an increase between 2 to 2.9 points, 19 centres between 1 to 1.9 points and 36 centres between 0.1 to 0.9 points. On the contrary, Bokaro recorded a maximum decrease of 1.8 points followed by Chennai and Salem with 1.7 and 1.2 points respectively. Among others, 19 centres observed a decline between 0.1 to 0.9 points. Rest of 3 centres remained stationary.
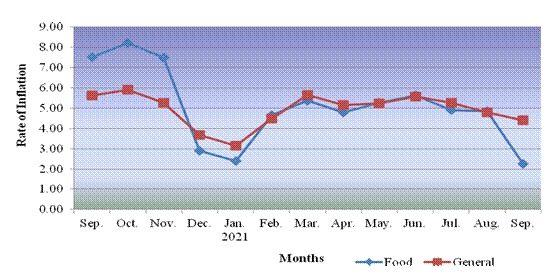
Year-on-year inflation for the month stood at 4.41 per cent compared to 4.79 per cent for the previous month and 5.62 per cent during the corresponding month a year before. Similarly, Food inflation stood at 2.26 per cent against 4.83 per cent of the previous month and 7.51 per cent during the corresponding month a year ago.
Y-o-Y Inflation based on CPI-IW (Food and General)

All-India Group-wise CPI-IW for August and September, 2021
Sr. No. | Groups | August, 2021 | September, 2021 |
I | Food & Beverages | 122.3 | 122.4 |
II | Pan, Supari, Tobacco & Intoxicants | 139.1 | 140.8 |
III | Clothing & Footwear | 121.0 | 121.5 |
IV | Housing | 116.8 | 116.8 |
V | Fuel & Light | 153.1 | 156.9 |
VI | Miscellaneous | 121.3 | 121.7 |
| General Index | 123.0 | 123.3 |
CPI-IW: Groups Indices

The next issue of CPI-IW for the month of October, 2021 will be released on Tuesday, 30th November, 2021. The same will also be available on the office website www.labourbureaunew.gov.in.
***
Saturday 30 October 2021
Friday 29 October 2021
Thursday 28 October 2021
UPU News: The true cost of the last mile
Tally up the number of things you bought online in the last week? Pre-lockdown it might have been a few online deliveries, the odd supermarket shop and maybe a cheeky takeaway on a Saturday night.


